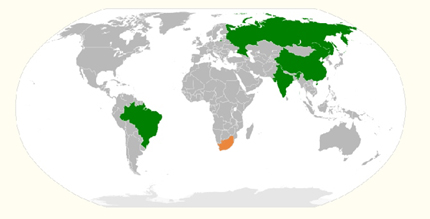
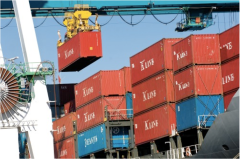
To reap the benefits of its recent membership of BRICS, South African businesses are looking at gaining a competitive edge through achieving global-standard supply chain performance, according to Supply Chain Junction, Manhattan Associates‘ Geo Partner in South Africa.
To reap the benefits of its recent membership of BRICS, South African businesses are looking at gaining a competitive edge through achieving global-standard supply chain performance, reports Supply Chain Junction, Manhattan Associates’ Geo Partner in South Africa. Unlike many other countries, South Africa was cushioned from the full impact of the world financial crisis thanks to the strict pre-existing credit controls it had in place. There were some knock on affects from close trading economies but over the last 15 months South Africa has enjoyed a growth economy. The International Monetary Fund (IMF) say this group will account for 61 per cent of global growth in three years time.
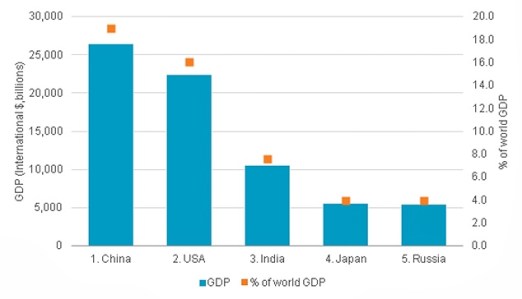
While South Africa’s economy (£506.91bn GDP) is dwarfed by those of the original BRIC constituents, the country is seen as the gateway to the continent of Africa, which as a whole has an equivalent sized economy ($2,763bn GDP), a population of one billion and rich resources. This has all made it a valued investment region for China in particular.
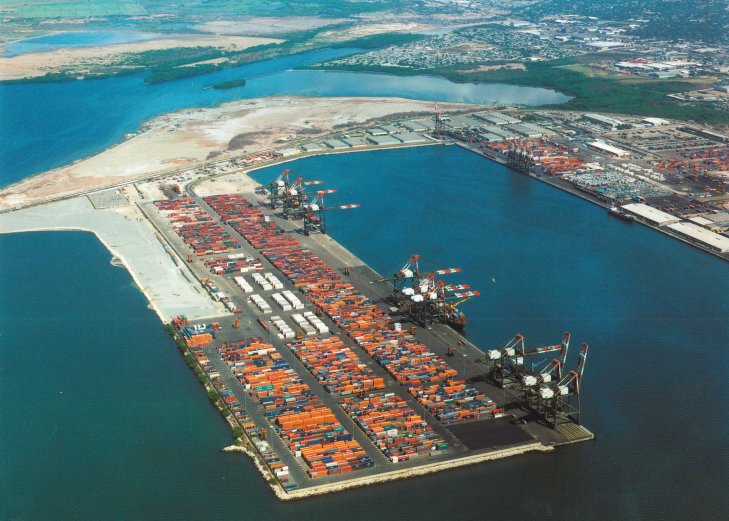
However, there are many cultural, logistical and geographical challenges the further one travels North from South Africa towards the Sahara. As an example, while there is 24,487 km of rail track in South Africa, there is just 259 km in Uganda; there are 92 mobile phones per 100 people in South Africa but just two per 100 in Eritrea. However, there is a great deal of raw potential, especially in countries such as Angola and Nigeria.
Participation in BRICS will drive a new competitiveness for South Africa and a key factor will be developing world-class supply chain management. Unlike in Europe, the US and Australia, few supply chain directors in South Africa sit on the board, which makes it harder for them to demonstrate how effective management of the supply chain can deliver competitive advantage. But this is likely to change as companies realise that they must align their supply chain and business strategies. If the recession failed to drive home the need for this, then the presence of Chinese companies in Africa will create significant pressure to do so.
This was an observation of the 2011 Supply Chain Foresight survey, conducted by Frost & Sullivan, which annually samples the opinions of South African supply chain executives. It found that while over three quarters of the respondents feel that the supply chain and business strategies of their companies are aligned, less than a third felt that the supply chain and logistics operations are fully optimised. Businesses are looking at how to optimise their distribution networks through building new facilities, streamlining existing processes or collaboration between trading partners. This has seen a lot of current activity surrounding warehouse management systems, forecasting, planning, replenishment and collaboration technologies, in particular.
Two thirds of respondents are considering investment in technology to enable collaboration with service providers. With the recession claiming many key suppliers the environment is changing from one where major companies squeeze suppliers on cost to one where they adopt a more collaborative approach. Cost reduction was the focus of the past recession, but now the objective is to satisfy customer expectations and to deliver value. Just over half of respondents to the Supply Chain Foresight survey cited customer service as the top supply chain objective. Reducing waste and improving efficiency in the supply chain are the perennial shorter term challenges with companies looking for better forecasting and planning tools to bring down inventory and shorten lean times. One interesting aspect of South African supply chain technology is the large number of in-house designed legacy systems, which is a consequence of the country’s isolation during the times of Apartheid. A propensity towards in-house designed systems remains today.
In terms of industry sectors, retail dominates but it remains firmly entrenched in the traditional channels. While some retailers have online retail websites, online and multi-channel is by no means a significant part of the current retail picture. Internet use is still quite low compared to other countries there are 4.42 million internet users in a population of 49 million and this figure is expected to remain low for some time yet. A further obstacle to the expansion of online sales is a high crime rate which leads to security issues in delivering goods to customers.
Wholesale distribution is quite small in size and complexity so the supply chain challenges tend not to be too complicated. There remain companies that feel they have been reasonably successful – being self-sufficient – and want to maintain that approach, along with a general tendency to look within, when it comes to benchmarking supply chains. However, a growing number of companies in South Africa recognise that there are other organizations across the globe doing similar things, but perhaps, a lot more efficiently.
Supply chain managers within these businesses are evolving a mindset focused on global best practice and the means of achieving it. These South African companies want to be best in their class. By building knowledge, benchmarking and improving against those benchmarks the win for this retailer is a supply chain that gives competitive advantage. As in other countries, companies looking to benefit from external expertise and a reduction in their capital costs will often outsource their logistics to third party logistics (3PL) operators. South Africa has numerous small local players and a handful of large lead logistics providers who tend to drive innovation. It is a small but highly competitive market. Logistics infrastructure and skills shortage in the supply chain continue to be huge issues in South Africa. The Supply Chain Foresight survey found that to deal with the skills shortage, in almost all areas companies either expose employees to new jobs through rotation, or development programs, or mentoring. These are generally in-house driven schemes. South Africa is an emerging market that is growing fast and offers a tremendous wealth of opportunities. In fact, the country has a great many successful businesses, and while many talk about becoming world class, many have already achieved it. Source: Supply Chain Junction
Related articles
- First BRICS Heads of Customs Meeting (mpoverello.com)
- Boost for Intra-African, BRICS Trade (mpoverello.com)
![Delegates who attended the first BRICS Customs Heads of Customs Meeting [SARS]](https://mpoverello.com/wp-content/uploads/2013/03/delegates-who-attended-the-first-brics-customs-heads-of-customs-meeting-sars_snapseed.jpg)


You must be logged in to post a comment.