WTO launches new WTO data portal

The WTO has launched a new WTO data portal to provide easy access to key databases offering trade statistics and information on WTO members’ trade-related measures.

The new portal allows users to navigate a wide range of WTO databases covering trade in goods, services, dispute settlement, environmental measures, trade-related intellectual property rights and more. 

One of the databases is the “WTO Stats portal“, which allows users to access and download time series statistics on trade in goods and services on an annual, quarterly and monthly basis. It also contains market access indicators providing information on governments’ bound, applied and preferential tariffs as well as non-tariff information and other indicators.

The data portal will be regularly updated to take account of new systems and updates.

The WTO data portal is available here. The WTO Stats portal can be accessed directly here.

Advertisement

Data is King!

Two recent articles reaching my desk reiterate the importance of clean and standardised Customs data. Without this, any real benefits to be derived from the latest and future technologies will not be fully achieved. Downstream, a country’s economy depends on this data for accurate analysis, forecasting and policy-making. Similarly, the business community relies on accurate information to assist in better business and investment decisions.

During the 15th PICARD Conference held during 23-26 November 2020, ‘World Customs Journal Special Edition’ was introduced. The first paper of the special edition is based on the keynote speech which was given at the 14th PICARD Conference in October 2019 titled “Data Science: Policy Implications for Customs”.

The paper referred to is titled –

“If algorithms dream of Customs, do customs of cialsdreamofalgorithms?A manifesto for data mobilisation in Customs

The Abstract of the document reads as follows –

“Governance by data is a growing global trend, supported by strong national public policies whose foundation is open data, artificial intelligence and decision-making supported by algorithms. Despite this trend and some technical advances, Customs face obstacles in deploying ambitious data use policies. This article describes these challenges through recent experience in some Customs administrations and considers the technical and ethical issues speci c to all law enforcement agencies in the context of customs missions, to open paths for research and propose policy recommendations for a better use of customs data.”

The second matter is perhaps more directed towards Africa. TRALAC Newsletter, of October 2002 titled “Trade and Related Matters discusses the importance of data, specifically now with the introduction of the African Continental Free Trade Area (AfCFTA) in January 2021.

The article considers more than just Customs trade data relating to goods. It envisages trade in services data as just as important to ensure a holistic approach –

“Trade-related data includes not only recorded values and volumes of goods trade among countries, but also data on services trade, non-tariff measures and barriers, tariffs, informal trade, trade restrictiveness, macro-economic conditions (like gross domestic product), micro-economic data (industry/firm-level data including employment, sales, profits and prices) and investment. This data is utilised by governments to make public policy decisions including the formulation of industrial, agriculture, trade and economic growth policies, strategies and regulations; trade negotiations strategies; merger and acquisition reviews; assessments of anti-competitive practices and determinations in trade remedy cases and applications for changes in tariffs. Businesses use trade information, such as tariffs in destination markets, applicable non-tariff measures, transportation costs and trade restrictiveness in combination with macro-economic indicators, firm-level data and market information to make investment, trade and market development decisions, and also to lodge trade remedy and tariff review applications and to inform their participation in public-private forums.”

The Newsletter continues to explain the notable improvements in data and reporting oer the last decade –

“Although trade and trade-related data has various uses, it needs to be useful, reliable and accurate information which is publicly available (except in the case of confidential information). This is the area where most African countries have historically fallen short although there has been some significant progress over the last decade. Initially, African trade data was only available on subscription databases and only for a select number of countries (like South Africa, Kenya and Egypt) and limited to trade in goods. There was a lack in published tariff schedules and data pertaining to non-tariff measures, investment, informal trade and services. In recent years, the availability of some data has improved significantly, especially for goods trade.

  • African countries are now increasingly publishing their statistics on websites of national statistics authorities and notifying their national data to the United Nations (UN). This data includes data on formal goods trade, aggregate services trade, non-tariff measures, tariffs, investment and some market information. The quality of the data has also improved as most countries now extensively verify the data prior to publication and submission. Increased access enables organisations like the World Bank, the World Trade Organisation (WTO) and International Trade Centre (ITC) to obtain, collate and publish trade data in databases like the ITC TradeMap and MacMap and the WTO trade portal.
  • As part of the implementation of the WTO Trade Facilitation Agreement, many countries are establishing trade portals. Southern and eastern African countries that already have functioning portals include Seychelles, Eswatini, Kenya, Rwanda and Uganda. Some portals contain detailed information on import and export requirements by specified product, sanitary and phytosanitary requirements, port of entry and applicable tariffs. The trade portals of countries in east Africa, including Uganda and Rwanda provide details of import or export processes including the trade costs such as inspection charges, and indicate the waiting time to complete the different steps.
  • Once fully operational, the African Trade Observatory (ATO) will contribute significantly to the availability of African trade data and capacity building. The ATO will collect and analyse trade and trade-related qualitative and quantitative data and information, establish a database for African trade; monitor implementation and evaluate the implementation process and impact of the AfCFTA and the Action Plan for Boosting Intra-Africa Trade (BIAT); and equip national governments and businesses to analyse and use of trade and related data.
  • There is increasing awareness of the effect of non-tariff barriers (NTBs) on intra-Africa trade. More information is available in the public domain through industry/product/sector studies, the trade cost database of the World Bank and the online non-tariff barrier mechanisms of the COMESA-EAC-SADC Tripartite Free Trade Area, the Borderless Alliance (west Africa) and the new AfCFTA mechanism.
  • Informal trade is recognised as a major component of intra-Africa trade and this is not captured in formal trade statistics. There are a number of initiatives to gather data on informal cross-border trade (ICBT), including studies by UNECAand ongoing work by the Bank of Uganda which has been conducting surveys and reporting ICBT data since 2005.

Although there have been improvements in intra-Africa trade data, there is room for improvement.”

New 2022 Edition of the Harmonized System has been accepted

Photo by Ricardo Gomez Angel on Unsplash

HS 2022, which is the seventh edition of the Harmonized System (HS) nomenclature used for the uniform classification of goods traded internationally all over the world, has been accepted by the all Contracting Parties to the Harmonized System Convention.  It shall come into force on 1 January 2022.

The HS serves as the basis for Customs tariffs and for the compilation of international trade statistics in 211 economies (of which 158 are Contracting Parties to the HS Convention).  The new HS2022 edition makes some major changes to the Harmonized System with a total of 351 sets of amendments covering a wide range of goods moving across borders.  Here are some of the highlights:

Adaption to current trade through the recognition of new product streams and addressing environmental and social issues of global concern are the major features of the HS 2022 amendments.

Visibility will be introduced to a number of high profile product streams in the 2022 Edition to recognise the changing trade patterns.  Electrical and electronic waste, commonly referred to as e-waste, is one example of a product class which presents significant policy concerns as well as a high value of trade, hence HS 2022 includes specific provisions for its classification to assist countries in their work under the Basel Convention.  New provisions for novel tobacco and nicotine based products resulted from the difficulties of the classification of these products, lack of visibility in trade statistics and the very high monetary value of this trade.  Unmanned aerial vehicles (UAVs), commonly referred to as drones, also gain their own specific provisions to simplify the classification of these aircraft.  Smartphones will gain their own subheading and Note, which will also clarify and confirm the current heading classification of these multifunctional devices.

Major reconfigurations have been undertaken for the subheadings of heading 70.19 for glass fibres and articles thereof and for heading 84.62 for metal forming machinery.  These changes recognize that the current subheadings do not adequately represent the technological advances in these sectors, leaving a lack of trade statistics important to the industries and potential classification difficulties.

One area which is a focus for the future is the classification of multi-purpose intermediate assemblies.  However, one very important example of such a product has already been addressed in HS 2022.  Flat panel display modules will be classified as a product in their own right which will simplify classification of these modules by removing the need to identify final use.  Health and safety has also featured in the changes.  The recognition of the dangers of delays in the deployment of tools for the rapid diagnosis of infectious diseases in outbreaks has led to changes to the provisions for such diagnostic kits to simplify classification.  New provisions for placebos and clinical trial kits for medical research to enable classification without information on the ingredients in a placebos will assist in facilitating cross-border medical research.  Cell cultures and cell therapy are among the product classes that have gained new and specific provisions.  On a human security level, a number of new provisions specifically provide for various dual use items.  These range from toxins to laboratory equipment.

Protection of society and the fight against terrorism are increasingly important roles for Customs.  Many new subheadings have been created for dual use goods that could be diverted for unauthorized use, such as radioactive materials and biological safety cabinets, as well as for items required for the construction of improvised explosive devices, such as detonators.

Goods specifically controlled under various Conventions have also been updated.  The HS 2022 Edition introduces new subheadings for specific chemicals controlled under the Chemical Weapons Convention (CWC), for certain hazardous chemicals controlled under the Rotterdam Convention and for certain persistent organic pollutants (POPs) controlled under the Stockholm Convention.  Furthermore, at the request of the International Narcotics Control Board (INCB), new subheadings have been introduced for the monitoring and control of fentanyls and their derivatives as well as two fentanyl precursors.  Major changes, including new heading Note 4 to Section VI and new heading 38.27, have been introduced for gases controlled under the Kigali Amendment of the Montreal Protocol.

The changes are not confined to creating new specific provisions for various goods.  The amendments also include clarification of texts to ensure uniform application of the nomenclature.  For example, there are changes for the clarification and alignment between French and English of the appropriate way to measure wood in the rough for the purposes of subheadings under heading 44.03.

Given the wide scope of the changes, there are many important changes not mentioned in this short introduction.  All interested parties are encourage to read the Recommendation carefully (to be published soon).

Implementation

While January 2022 may seem far off, a lot of work needs to be done at WCO, national and regional levels for the timely implementation of the new HS edition.  The WCO is currently working on the development of requisite correlation tables between the current 2017 and the new edition of the HS, and on updating the HS publications, such as the Explanatory Notes, the Classification Opinions, the Alphabetical Index and the HS online database.

Customs administrations and regional economic communities have a huge task to ensure timely implementation of the 2022 HS Edition, as required by the HS Convention.  They are therefore encouraged to begin the process of preparing for the implementation of HS 2022 in their national Customs tariff or statistical nomenclatures. The WCO will step up its capacity building efforts to assist Members with their implementation.

Source: hs@wcoomd.org

Weight or number? Indian Customs seeks to bring uniformity to measurement of goods

Customs_&_Central_Excise_DKB

Are toilet seats bought by the kilogram or on a per piece basis? Should tableware or porcelain be measured by weight or as a unit? Likewise with a coffee table — weight or number? The answers may seem obvious but they’re not. Differences in commercial practices and customs guidelines on the measurement of some goods may have wreaked havoc with the country’s trade statistics, not to mention sparking a plethora of disputes and delays in the clearance of consignments.

The Central Board of Excise and Customs (CBEC), India has now begun a review of standard unit quantity codes (UQC) to address the issue and help improve the ease of doing business while reducing the scope for disputes. India has already identified ‘trade across borders’ as one of the areas where it can show substantial improvement in ease of doing business.

India is ranked 119 on this count in the World Bank’s latest rankings.

“There are issues particularly in some tariff lines… We are now looking at how we can bring about uniformity,” said a government official. For instance, UQC for products under Heading 6911— tableware, kitchenware and other household articles, and toilet articles of porcelain or china—is in kilogram.

However, the trade transacts in units or by number of pieces. Moreover, there is no uniformity in UQC declarations by traders. These are not the same for a particular item at different customs locations. The World Customs Organization has prescribed standard UQCs that are used internationally. India implemented mandatory standard UQCs from 2013 as part of export-import declarations.

There are inconsistencies in the way these have been applied. Variance in codes is approved by field officials, which makes the system subject to discretion and interpretation. CBEC has reached out to the industry to arrive at ways in which the matter can be addressed.

“Use of standardised UQC as prescribed in Customs Tariff Act, 1975, is a challenge at times faced by trade due to different market practices,” said Rahul Shukla, executive director, PwC.

“The same has been recognized by the customs authorities and they have supported the trade in resolving it as well on case-to-case basis. Shukla said the proposed move by CBEC to take another look at UQCs prescribed in the Customs Tariff Act and align them with practice was a positive move and in line with the continued commitment to trade facilitation.

“It will help if CBEC can consider allowing multiple UQCs for the same commodity or adopting a particular UQC which is used more frequently by trade,” he said. India jumped 30 places to 100 in World Bank’s overall ease of doing business rankings in the latest listing released in October after undertaking various reforms to improve the environment. Source: By Deepshikha Sikarwar, The Economic Times, India, 8 January 2018.

Chamber of Mines goes after UNCTAD over faulty trade misinvoicing report

Chamber of Mines

The report claimed there was widespread misinvoicing in primary commodities in developing countries, including South Africa.

The Chamber of Mines on Tuesday called on the United Nations Conference on Trade and Development (UNCTAD) to withdraw its report on trade misinvoicing and acknowledge its shortcomings, saying that the prestigious agency had failed to collect its data accurately.

This comes after the Chamber released the third and final report in a series commissioned to examine the July 2016 UNCTAD report that claimed there was widespread misinvoicing in primary commodities in developing countries, including South Africa.

Also read Maya Forestater’s blog post Misinvoicing or misunderstanding? for an incisive explanation regarding the UN’s claims in its recent report Trade Misinvoicing in Primary Commodities in Developing Countries.

The UNCTAD report titled “Trade Misinvoicing in Primary Commodities in Developing Countries: The cases of Chile, Cote d’Ivoire, Nigeria, South Africa and Zambia”, claimed to have found widespread under-invoicing which, it alleged, was designed by commodities producers to evade tax and other entitlements due to the fiscal authorities.

UNCTAD said some commodity dependent developing countries were losing as much as 67 percent of their exports worth billions of dollars to trade misinvoicing.

For South Africa, the report calculated cumulative under-invoicing over the period 2000-2014 to have amounted to U.S.$102.8 billion; which was U.S.$620 million for iron ore, U.S.$24 billion for silver and platinum, and U.S.$78.2 billion for gold.

UNCTAD revised the report in December, though its fundamentals remained unchanged.

The Chamber of Mines also commissioned Eunomix to compile its own reports which were published in December and February respectively, focusing on UNCTAD’s gold scenarios.

The third report, which was published on Tuesday, deals with the other commodities.

The Chamber said in terms of gold, the UNCTAD study methodology compared reported exports by product and country of destination with the reported imports of the products by those same countries, and did not use other widely available data, including that of Statistics SA and the Reserve Bank.

The Chamber also dismissed all other UNCTAD findings in terms of silver and platinum, and iron ore.

The Chamber said all the factors that UNCTAD did not consider reinforced the point made in the earlier Eunomix reports regarding the lack of rigour and unreliable methodologies used in UNCTAD’s report.

“This is extremely unfortunate given the levels of credence that tend to be given to reports of this UN agency. Accusations of extensive misinvoicing and other illicit financial flows are feeding a growing lack of trust between key stakeholders in the mining industry,” the Chamber said.

“The Chamber of Mines again calls on UNCTAD to withdraw this report and acknowledge its shortcomings.” Source: The Citizen, Business News, 22 Aug, 2017. [Picture: Chamber of Mines]

WTO Bali – Trade Facilitation Agreement

WTO-globalvoices_org__au_The draft text relating to the outcome on a Trade Facilitation Agreement at 9th Ministerial Conference of the WTO can be located here!   It reveals some significant impact and far-reaching implications for the Customs administrations, but to a great extent it will probably be welcomed by the world’s trading community. In the South African context, readers may find Article 11 on “Freedom of Transit” extremely interesting, if not controversial by some members of the establishment. In essence it’s all about being transparent! Source: World Trade Organisation.

SACU – the Day of Reckoning has Arrived

South Africa has been courting major player Botswana’s support for changes to SACU.

South Africa has been courting major player Botswana’s support for changes to SACU. (Mail & Guardian)

The Mail & Guardian reveals that South Africa has requested an urgent meeting with members of the Southern African Customs Union (SACU) for as early as ­February next year in what could be a make-or-break conference for the struggling union.

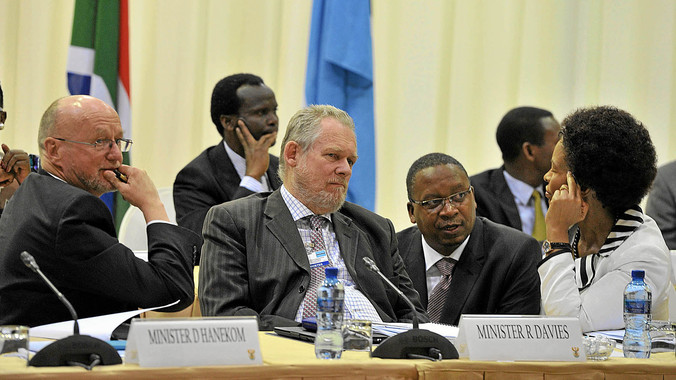
In July this year, a clearly frustrated Trade and Industry Minister Rob Davies told Parliament that there had been little progress on a 2011 agreement intended to advance the region’s development integration, and it was stifling its real ­economic development.

South Africa’s payments to SACU currently amount to R48.3-billion annually – a substantial amount, considering the budget deficit is presently R146.9-billion, an estimated 4.5% of gross domestic product.

In the past, South Africa has had some room to reposition itself, but as Finance Minister Pravin Gordhan has pointed out, the South African fiscus has come under a lot of pressure as a result of factors such as the global slowdown, reduction in demand from countries such as China for commodities, and reduced demand from trade partners such as the European Union.

South Africa, which according to research data, last year contributed 1.26% of its GDP, or about 98% of the pool of customs and excise duties that are shared between union countries including Swaziland, Botswana, Lesotho and Namibia, wants a percentage of this money to be set aside for regional and industrial development.

The four countries receive 55% of the proceeds, and are greatly dependent on this money, which makes up between 25% and 60% of their budget revenue. South Africa has very little direct benefit, except when it comes to exporting to these countries. It receives few imports.

Changing the revenue-sharing arrangement

Efforts to change the revenue-sharing arrangement so that money can be set aside for regional development would result in less money going into the coffers of these countries.

It would also mean that a portion of the revenue that South Africa’s SACU partners now receive with no strings attached would in future include restrictions on how it is spent.

A source close to the department said adjustments to the revenue-sharing arrangement and the promotion of regional and industrial development were issues on which the South African government was not willing to budge.

So seriously is South Africa viewing the lack of progress on the 2011 agreement, a document prepared for Cabinet discussion includes pulling out of SACU as one of its options, a source told the Mail & Guardian.

This could not be confirmed by the government, but two senior sources said South Africa was very aware of the dependence of its neighbours on income from the customs union, in particular Swaziland and Lesotho, and the impact its collapse could have on these economies.

Professor Jannie Rossouw of the University of South Africa’s department of economics believes a new revenue-sharing arrangement is essential for the long-term sustainability of SACU countries.

South Africa’s contribution

He also said that South Africa’s contribution as it presently stands should be recognised as development aid and treated as such by the international community.

Between 2002 and 2013, total transfers amounted to 0.92% of South Africa’s GDP, which exceeds the international benchmark of 0.7% set by the Organisation for Economic Co-operation and Development, he said in his research.

“It is noteworthy that South Africa transfers nearly all customs collections to SACU countries. Total collection since 2002 amounted to about R249-billion, while transfers to SACU were about R242-billion,” Rossouw said. The South African Revenue Service (SARS) recognises that inclusion of trade with Sacu would have a substantial impact on South Africa’s ­official trade balance.

South Africa’s total trade deficit for 2012 was R116.9-billion and, according to SARS, had trade with the union been included, it would have been much reduced to R34.6-billion.

South Africa has budgeted to increase its allocation to SACU from R42.3-billion in the 2012-2013 financial year to R43.3-billion this financial year and in the 2014/2015 financial year.

In 2002, the SACU agreement was modified to include higher allocations for the most vulnerable countries, Swaziland and Lesotho, and it established a council of ministers, which introduced a requirement for key issues to be decided jointly. In 2011, a summit was convened by President Jacob Zuma in which a five-point plan was established to advance regional integration.

Review of the revenue-sharing arrangement

This involved a review of the revenue-sharing arrangement; prioritising regional cross-border industrial development; making cross-border trade easier; developing SACU ­institutions such as the National Bodies (entrusted with receiving requests for tariff changes) and a SACU tariff board that would eventually take over the functions of South Africa’s International Trade Administration Commission (ITAC); and the development of a unified approach to trade negotiations with third parties.

Davies told Parliament that there had been little progress in the past three years on these five issues.

Xavier Carim, the director general of the international trade division of the department of trade and industry, said there had been positive developments regarding agreements on trade negotiations, such as those with the European Union and India on trade, and progress had been made on the development of SACU institutions, but progress was slow on the other issues.

Davies told Parliament it was difficult to develop common policy among countries that varied dramatically in economic size, ­population and levels of economic, legislative and institutional development.

He cited differences over approaches to tariff settings as an example.

“South Africa views tariffs as tools of industrial policy, while for other countries tariffs are viewed as a source of revenue,” Davies said.

A proposal that cause all the problem

“A key problem that led to differences was the proposal by one member for lower tariffs to import goods from global sources that were cheapest, which ultimately undermined the industry of another member. This was primarily an issue of countries who viewed themselves as consumers rather than producers.”

The South African government is trying diplomacy as its first option. A senior government source said issues around SACU made up a large part of talks last week between Botswana and South Africa on the establishment of co-operative agreements on trade, transport and border co-operation.

Catherine Grant of the South African Institute of International Affairs said Botswana had long been considered the leader of the four countries. It would make sense for South Africa to bring Botswana on board before the meeting.

Grant said the SACU agreement needed to be re-examined and modernised.

“There needs to be a review of the revenue-sharing formula that is less opaque and is easier to understand. The present system is complicated, making it hard to work out exactly how much countries are getting. It’s clear that Rob Davies feels hamstrung by SACU and has done for some time, because decisions cannot be made without the agreement of all five members, who have different needs and requirements.”

The trade balance is one of the elements that resulted in South Africa’s current account, which has recorded significant deficits in recent months, coming in as high as 6.5% of GDP in the second quarter of 2013.

Trade between South Africa and SACU has always been recorded, but for historical reasons it has been kept separate from official international trade statistics. Source: Mail & Guradian


SARS – SA trade statistics will in future include trade data with BLNS countries

Import exportThe Minister of Finance has approved that South Africa’s trade statistics will in future include data in respect of trade with Botswana, Lesotho, Namibia and Swaziland (BLNS countries).

BLNS country-trade statistics have previously not been included in the trade statistics. This arose historically because of the free flow of trade from a customs duty point of view within the Southern African Customs Union (SACU).

BLNS merchandise trade however, has a material impact on South Africa’s trade balance. South Africa exported R103.8bn to and imported R21.5bn from BLNS countries. In the last full year (2012) this resulted in a positive trade balance of R82.3bn for trade with BLNS countries.

South Africa’s total trade deficit for 2012 was R116.9bn. Had the BLNS trade data been included, the deficit would have been R34.6bn.

The view is therefore that direct trade within the BLNS countries should be included in the calculation of the monthly trade statistics to provide a more accurate reflection of South Africa’s trade.

Furthermore, SARS’s customs modernisation programme has resulted in its systems moving to new technologically enhanced platforms that enabled better electronic capturing of trade data that was previously done manually. The modernised system greatly improves the accuracy of trade data and allows the reporting and analysis of trade data to be done in real-time.

SARS worked very closely with the National Treasury (NT) and the South Africa Reserve Bank (SARB) in preparing the trade statistics that includes trade with the BLNS countries.

The SARB has welcomed the revision of the trade statistics “as valuable additions to building block data used to compile South Africa’s balance of payments.”

“While the Bank has always included estimates of the trade between South Africa and this group of countries in its compilation of South Africa’s overall imports and exports, the new building block data will be incorporated in the balance of payments, leading to improved measurement. Previously published statistics will also be revised. The revised balance of payments data for South Africa will be finalised in the next few weeks and published in the Bank’s Quarterly Bulletin, due to be released on 3 December 2013,” the SARB said in a statement.

Although SARS is confident as to the accuracy of the BLNS trade numbers, it is SARS’s intention to approach the United Nations to review the treatment of South Africa’s trade data that will now include BLNS trade numbers.

In addition to the inclusion of the BLNS trade figures, SARS is also contemplating certain other revisions to improve the reporting of trade statistics in the future. Some of these include the following:

  • publishing of imports on both a Free On Board (FOB) and a Cost Insurance Freight (CIF) basis to align it with UN principles,
  • compiling statistics on the date when the goods are actually released into or from South Africa’s economy, rather than using the date on which the goods entered the customs’ system for ultimate release from or into the SA economy, and
  • publishing gold exports as recorded on the SARS system reflecting the physical export movement of gold as opposed to the current practice of reporting the SARB gold export data on the IMF change of ownership basis.
  • These changes will however, only be finalised and implemented after consultation with international experts and other relevant stakeholders.

For more details visit sars.gov.za


Trade Information Portal to Improve Trade Facilitation in Namibia

Namibia flagThe World Trade Organization General Agreement on Tariff and Trade (GATT) 1994 Article X on Trade Facilitation calls for member country trade regulations to be clearly published. The WTO Self-Assessment Guide (2009) outlines the basic standard for internet Publication as: “A Member shall publish all trade related legislation, procedures and documents on a national official internet site or sites”. Usually called a “Trade Repository” or a “Trade Information Portal” the site facilitates awareness, via the internet, of requirements to enable compliance with customs and other agency requirements for the import or export of goods, using the HS classification of goods as the primary organizing principle for cataloguing and retrieving information

USAID Southern African Trade Hub reports that the government of Namibia expects to have its Trade Information Portal up and running by early 2014. The development of portal is supported by the USAID Southern Africa Trade Hub, under its Partnership for Trade Facilitation facility. The Trade Hub recently supported Namibia in a detailed legislative review of the country’s Customs and Excise Act to align it with global and regional legislation and to provide the legislative foundations for electronic trade facilitation measures, including the Trade Information Portal.

Currently trade-related information is made available across number of websites maintained by each government agency responsible for a particular aspect of trade regulation. The Trade Information Portal will provide a single platform where all trade related information for Namibia is collected in one system and readily available for searching and viewing, which will save time and expense for the trading community. The Trade Information Portal uses the latest technology to provide a comprehensive, accurate and up-to-date source for all regulatory information, which will result in tangible benefits for trade facilitation. No longer will it be necessary to seek advice in person from multiple agencies. Furthermore, conflicting advice and guidelines will be avoided by creating a single authoritative reference point. The savings in time and expense will lessen the overall cost of doing business and reduce the time to import or export goods, contributing to Namibia’s improved standing in doing business indexes and transparency.

A significant part of the coordination and development work in setting up the Trade Information Portal will facilitate and shorten the road map towards implementing an electronic National Single Window which is also under consideration by the Namibia government. Source: satradehub.org

Namibia – Weak Rand Plays Havoc With Trade Balance

south-african-rand-zar-bearishThe continued weakening of the Rand and an increase in the volume of imports has seen Namibia’s trade deficit widen to N$17 billion, the Namibia Statistics Agency (NSA) has said.

The country’s import bill jumped 24% in 2012 to N$59 billion widening the trade deficit to N$17 billion compared to N$11 billion in 2011. Despite a fall in the share of some of the major imports to the total import bill, the value of imports still increased to N$59 billion compared to N$48 billion in the previous year.

Major imports for 2012 included mineral fuels, mineral oils, vehicles, boilers and machinery. Fuel dominated the list of imports with a share of 13% up from 9% in the previous year. Vehicles were in second place with a share of 11% (compared to 12% in 2011) of total imports. Boilers, machinery and mechanical appliances occupied third place with 9% a slight decline from 10% in 2011.

The Statistics Agency said an 80% increase in the value of oil imports (at N$7.8 billion) can be explained by a 14% depreciation of the Namibia Dollar/Rand against the US$ in the period under review since the 2012 average price of oil in US dollars was almost the same as in 2011. In addition, an increase in the volume of imports especially ships, boats and floating structures that recorded the strongest increase of almost 2100%, also contributed to the widening deficits.

South Africa remains Namibia’s most important trading partner with combined trade between the two countries amounting to N$48.6 billion in 2012. However, the direction of trade between the two countries remain skewed with Namibia importing N$41.6 billion worth of goods from South Africa, while exporting goods worth only N$7 billion to South Africa.

Analysts say while a weaker local currency boosts earnings of companies that sell their goods overseas, it adds to import costs, making food and fuel more expensive. With a relatively low industrial base, and a saturation in the mining sector, Namibia’s exports only grew marginally to N$42 billion up from N$37 billion in 2011. This growth is too small to have a meaningful impact on the widening trade deficit.

In 2013, the construction of the multi-billion dollar Husab Project, the Grove Mall and Square, Strand Hotel, the container terminal at Walvis Bay, and the Neckartal Dam is likely to put further pressure on the import bill worsening Namibia’s trade deficit even further. An estimated 80% of capital goods for these projects will be imported. Source: The Economist (Namibia)

Chinese Imports surge – outpace Exports

Port of Shanghai

Port of Shanghai

China’s exports rose 25 percent in January from a year earlier while imports increased 28.8 percent, resulting in a trade surplus of $29.15 billion, the customs administration said today in Beijing.

The growth in overseas shipments compares with the median estimate in a Bloomberg News survey for a 17.5 percent expansion and a 14.1 percent increase the previous month.

The gain in imports compares with the median estimate for a 23.5 percent jump and a 6 percent increase in December. The trade surplus compared with the median projection for $24.7 billion and a $27.1 billion excess a year ago.

The Chinese customs administration last month defended the quality of its trade data after analysts at Australia & New Zealand Banking Group Ltd. and UBS AG said it may fail to capture the true picture of imports and exports.

Trade data in the first two months of the year is distorted by the timing of the Lunar New Year holiday, which fell in January in 2012 and is in early February this year, making the figures tough to interpret, according to economists including Louis Kuijs, chief China economist at Royal Bank of Scotland Plc in Hong Kong. Source: Bloomberg