ICC – Controlling the zone: balancing facilitation and control to combat illicit trade in the world’s free trade zones

Photo by Noel Broda on Unsplash

Herewith a 2020 update of the ICC BASCAP report assessing the environment and highlighting trends in counterfeiting and other forms of illicit trade facilitated within free trade zones.

The Risks

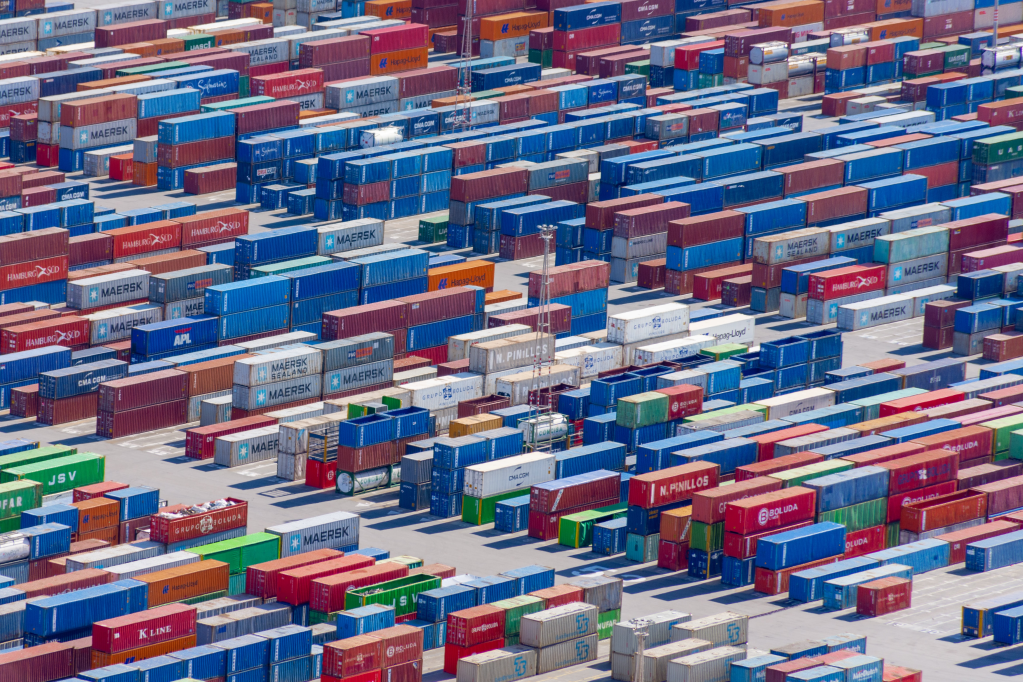
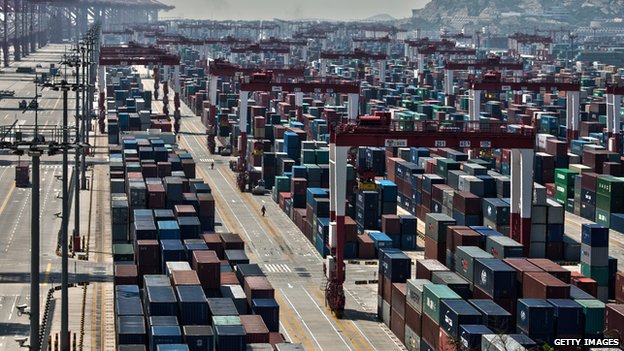
Free Trade Zones (FTZs) provide significant opportunities for legitimate business and play a critical role in global trade as well as economic growth for the host nation.  However, our updated research has continued to confirm that insufficient oversight remains a major enabler of illicit activities.  Since the publication of our previous 2013 report, there have not been vast improvements in limiting criminal activities within FTZs.  In fact, the Covid-19 pandemic has increased vulnerability for abuses by criminal actors who take advantage of supply chain shortages and increased demands as well as relaxed oversight often because of such things as quarantines that have softened Customs control.

Counterfeiters use transit or transhipment of goods, through multiple, geographically diverse FTZs for no other purpose than to disguise the illicit nature of the products. Once introduced into an FTZ, counterfeit goods may undergo a series of economic operations, including assembly, manufacturing, processing, warehousing, re-packaging, and re-labelling. Once completed, the goods can be imported directly to the national territory of the hosting state or re-exported to another country for distribution or to another FTZ, where the process is repeated.

Key recommendations:

Our 2020 report promotes a set of specific policy and legislative recommendations on how to preserve and expand the benefits of FTZs for legitimate traders and protect the public and honest businesses from predatory practices. These recommendations are based on a review of the international and national legal frameworks governing FTZs, including how they are implemented and enforced.

Suggested recommendations include:

  • empowering Customs with jurisdiction over day-to-day operations within FTZs
  • strengthening relationship between Customs and FTZs
  • clarifying and declaring that FTZs remain under the jurisdiction of the national Customs authority
  • enhancing data sharing between Customs and the private sector
  • strengthening national government adherence to international conventions and implementation of international standards
  • legislatively ensuring that strict penalties are in place, including criminal sanctions where appropriate, against perpetrators of illegal activities in FTZs
  • that manufacturers and shippers recognize and use the ICC World Chambers Foundation’s International Certificates of Origin (COs) Accreditation Chain which is a program that accredits chambers of commerce issuing COs wishing to guarantee their commitment to the highest level of quality, implementing transparent and accountable issuance and verification procedures. Accredited chambers will receive a distinctive internationally recognized quality classification, reinforcing their integrity and credibility as competent trusted third parties in the issuance of COs.

Additionally, the new document also provides specific recommendations such as drawing on international agreements, lessons learned from effective and ineffective national legislation, the experience of IP rights holders, and legislative and regulatory measures to enforce intellectual property right protection in FTZs.  These specific recommendations are delineated in the report for action by the World Customs Organization, World Trade Organization, national governments, and FTZ operators. Effective implementation of the measures delineated for each of these bodies will go a long way in securing FTZs from illicit traders.

Download the Document via this hyperlink

Source: International Chamber of Commerce

Advertisement

African Countries of the Future 2013/14

fDI 2013-14 Rankings for Africa

fDI 2013-14 Rankings for Africa

South Africa has been crowned as the African Country of the Future for 2013/14 by fDi Magazine, One of the economic powerhouses of the African continent, South Africa has been named fDi Magazine’s African Country of the Future 2013/14, with Morocco in second position and Mauritius in third. New entries into the top 10 include Nigeria and Botswana. Click here to access the full report!

South Africa has consistently outperformed its African neighbours in FDI attraction since fDi Markets records began in 2003. Figures for 2012 build upon South Africa’s historical prominence as an FDI destination with the country attracting about one-fifth of all investments into the continent – more than double its closest African rival, Morocco. In 2012, FDI into South Africa amounted to $4.6bn-worth of capital investment and the creation of almost 14,000 jobs.

South Africa claimed the title of fDi’s African Country of the Future 2013/14 by performing well across most categories, obtaining a top three position for Economic Potential, Infrastructure and Business Friendliness. Its attractiveness to investors is evident in its recent FDI performance, where the country defied the global trend with 2011 and 2012 figures surpassing its pre-crisis 2008 statistics. Despite a slight decline of 3.9% in 2012, South Africa increased its market share of global FDI, which further increased in the first five months of 2013 as the country attracted 1.37% of global greenfield investment projects. According to fDi Markets, South Africa now ranks as the 16th top FDI destination country in the world.

South Africa’s largest city, Johannesburg, was the top destination for FDI into Africa and is one of only five African cities that attracted more investments in the first five months of 2013 compared to the same period of 2012. South Africa ranked third behind the US and the UK as a top source market for the African continent in 2012, accounting for 9.2% of FDI projects.

In 2010, South Africa became the ‘S’ of the BRICS – five major emerging national economies made up by Brazil, Russia, India and China. While FDI into South Africa fell 3.9% in 2012, this was the lowest recorded decline of the BRICS grouping which, on average, experienced a 20.7% decline in FDI. In its submission for fDi’s African Countries of the Future 2013/14, Trade and Investment South Africa (TISA) stresses the importance of the country’s attachments to its BRICS partners. Source: fDI Magazine

The Material Footprint of Nations and ‘True’ Material Cost of Development

High Density Container Terminal  (Picture credit - Getty Images)

High Density Container Terminal (Picture credit – BBC News/Getty Images)

Thanks to the kind reader who passed me this story. BBC News Environment correspondent, Matt McGrath, reports that current methods of measuring the full material cost of imported goods are highly inaccurate. In a new study, researchers have found that three times as many raw materials are used to process and export traded goods than are used in their manufacture.

Richer countries who believe they have succeeded in developing sustainably are mistaken say the authors. The research has been published  (click hyperlink to access the report) in the Proceedings of the National Academy of Sciences.

Many developed nations believe they are on a path to sustainable development, as their economic growth has risen over the past 20 years but the level of raw materials they are consuming has declined.

According to  Dr Tommy Wiedmann University of New South Wales “We are saying there is something missing, if we only look at the one indicator we get the wrong information”. This new study indicates that these countries are not including the use of raw materials that never leave their country of origin.

The researchers used a new model that looked at metal ores, biomass, fossil fuels and construction materials to produce what they say is a more comprehensive picture of the “material footprint” of 186 countries over a 20 year period.

“The trade figure just looks at the physical amounts of material traded, but it doesn’t take into account the materials that are used to produce these goods that are traded – so for something like fertiliser, you need to mine phosphate rocks, you need machinery, so you need extra materials.”

In this analysis, the Chinese economy had the largest material footprint, twice as large as the US and four times that of Japan and India. The majority comes from construction minerals, reflecting the rapid industrialisation and urbanisation in China over the past 20 years.

The US is by far the largest importer of these primary resources when they are included in trade. Per capita, the picture is different, with the largest exporters of embodied raw materials being Australia and Chile.

According to the model, South Africa was the only country which had increased growth and decreased consumption of materials.

The researchers believe their analysis shows that the pressure on raw materials doesn’t necessarily decline as affluence grows. They argue that humanity is using natural materials at a level never seen before, with far-reaching environmental consequences.

They hope the new material footprint model will inform the sustainable management of resources such as water. The authors believe it could lead to fairer and more effective climate agreements.

“Countries could think about agreements where they help reduce the emissions at that point of material use,” said Dr Wiedmann. “That’s where it is cheapest to do, where it is most efficient, where it makes more sense.” Source: BBC News

Having difficulty understanding economic zones?

You can be forgiven if you have a clouded understanding of what an economic zone is. Countries develop different types of free economic zones (FEZs) as a tool to generate employment opportunities, promote and diversify exports, increase technology transfer and attract investment flows. Developing and emerging economies use FEZs as “economic laboratories”, “incubators” or showcases of a generally strong enabling environment and a competitive market for investment. In order to achieve the intended objectives of zones, governments offer a range of incentives from fiscal to regulatory such as export duty exemptions, streamlined customs and administrative controls and procedures, liberal foreign exchange policies and income tax incentives. Governments have been experimenting with the use of policy tools in ensuring the effectiveness of their zones; however they have not always been successful. Nowadays, governments are trying to move away from the traditional zones with the traditional set of objectives and policy tools to either more comprehensive or sector specific zones. In addition, they are trying to incorporate other development policy instruments to their policy packages to tackle other issues such as skills development, rural development and green growth while achieving the traditional objectives.

The first type of FEZs mostly took the form of free ports – customs free areas within seaports offering little more than warehousing and trade facilities. Over time, some free ports developed into customs-free zones in which light manufacturing and other processing took place. The next step was the development of export processing zones, which encourage more complicated manufacturing operations with the purpose of exporting. Later, special economic zones (SEZs) and specialized zones (SZs) evolved. SEZs offer a wider array of sectors including manufacturing and services that target both foreign and domestic markets. In addition, they permit on-site residence and provide all facilities to employees and hence could be viewed as standalone cities. On the other hand, specialized zones (SZs) focus on specific industries by providing the appropriate infrastructure and building on the concepts of clusters.

The terminology applied to free economic zones, in literature and common usage, is highly confusing. Words like “free zones”, “free trade zones”, “customs-free zones”, “special economic zones”, “export processing zones”, etc. are in practice used almost interchangeably. This reflects the implementing authorities’ linguistic preferences as much as functional differences between different kinds of zones.

Common to most FEZs is the fact that they are ring-fenced enclaves (with the exception of Single Factory/Private EPZs) that enjoy special regulatory, incentive and institutional frameworks that are different from the rest of the economy. The different classifications of FEZs are as follows:

  1. Free trade zones (FTZs; also known as commercial free zones): are fenced-in, duty-free areas, offering warehousing, storage, and distribution facilities for trade, trans-shipment, and re-export operations.
  2. Export processing zones (EPZs): are industrial estates aimed primarily at attracting export-oriented investments. They cover usually a wide array of manufacturing industries.
  3. Private zones/Single factory processing zones: provide incentives to individual enterprises regardless of location.
  4. Special economic zones (SEZs): are larger estates and could be considered cities on their own. They usually cover all industrial and service sectors and target both foreign and domestic markets. They provide an array of incentives ranging from tax incentives to regulatory incentives. In addition, they permit on-site residence.
  5. Specialized zones (SZs): targeted at specific sectors or economic activities. Examples of SZs include science/technology parks, petrochemical zones, logistics parks, airport-based zones, and so on. They may restrict the access of companies in non-priority sectors, and their infrastructure is mostly tailored according to their sectoral targets.

The distinction between the different kinds of zones must involve an element of judgment and sometimes zones fall in between categories. South Africa’s Industrial Development Zones (IDZs) combine elements of both 1 and 2 above. Most free zones restrict the access of certain categories of investors, without necessarily being classified as specialized zones. Also, it is not very clear how “special” a free zone’s regulatory environment must be before it can be classified as a SEZ. FEZs in their general definition can include a combination of characteristics from all the previously identified FEZs. I guess that while you still dont have a clear understanding of what an economic zone is, I hope the above has shed a little more light on the subject?

New Models for addressing supply chain and transport risk

Trends such as globalization, lean processes, mass travel and the geographical concentration of production have made supply chain and transport networks more efficient, but have also changed their risk profile. This World Economic Forum report, produced in collaboration with Accenture, calls for new models to address supply chain and transport risks. It highlights the urgent need to review risk management practices to keep pace with rapidly changing contingencies facing the supply chain, transport, aviation and travel sectors. Download the full report here! Source: Creamer Media